---
title: How to create a Heatmap?
description: Heatmaps are visual representations that use color gradients to show data density or intensity, helping you analyze trends effectively.
---
[Skip to content](https://help.proqio.com/how-create-a-heatmap#main-content)
[](https://help.proqio.com/?hsLang=en)
Open main navigation
Close main navigation
How can we help you?
- There are no suggestions because the search field is empty.
1. [Knowledge base](https://help.proqio.com/?hsLang=en)
2. [Map](https://help.proqio.com/map?hsLang=en)
3. [Analysis](https://help.proqio.com/map?hsLang=en#analysis)
# How to create a Heatmap?
[Area Tool](https://help.proqio.com/how-to-use-the-area-tool?hsLang=en) allows you to define boundaries, select instruments, and perform various tasks, including creating heatmaps. Heatmaps are visual representations that use color gradients to show data density or intensity, helping you analyze trends effectively.
### Defining boundary
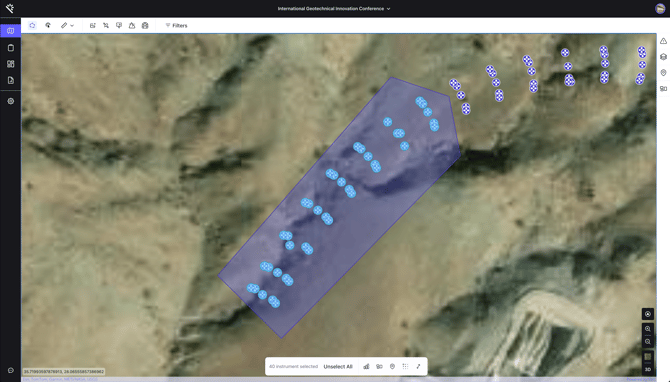
1. **Area Tool:** To begin, navigate to the **Map** and select the **Area Tool** from the toolbar. This tool enables you to define and manage specific areas within your project.
2. **Define an Area:** Use the **left-click** on the map to start defining your area. Continue clicking to outline the desired boundary. This step helps establish a specific space for analysis. Once you’ve outlined the area, double-click the last point to confirm and release the area.
---
### Creating the Heatmap
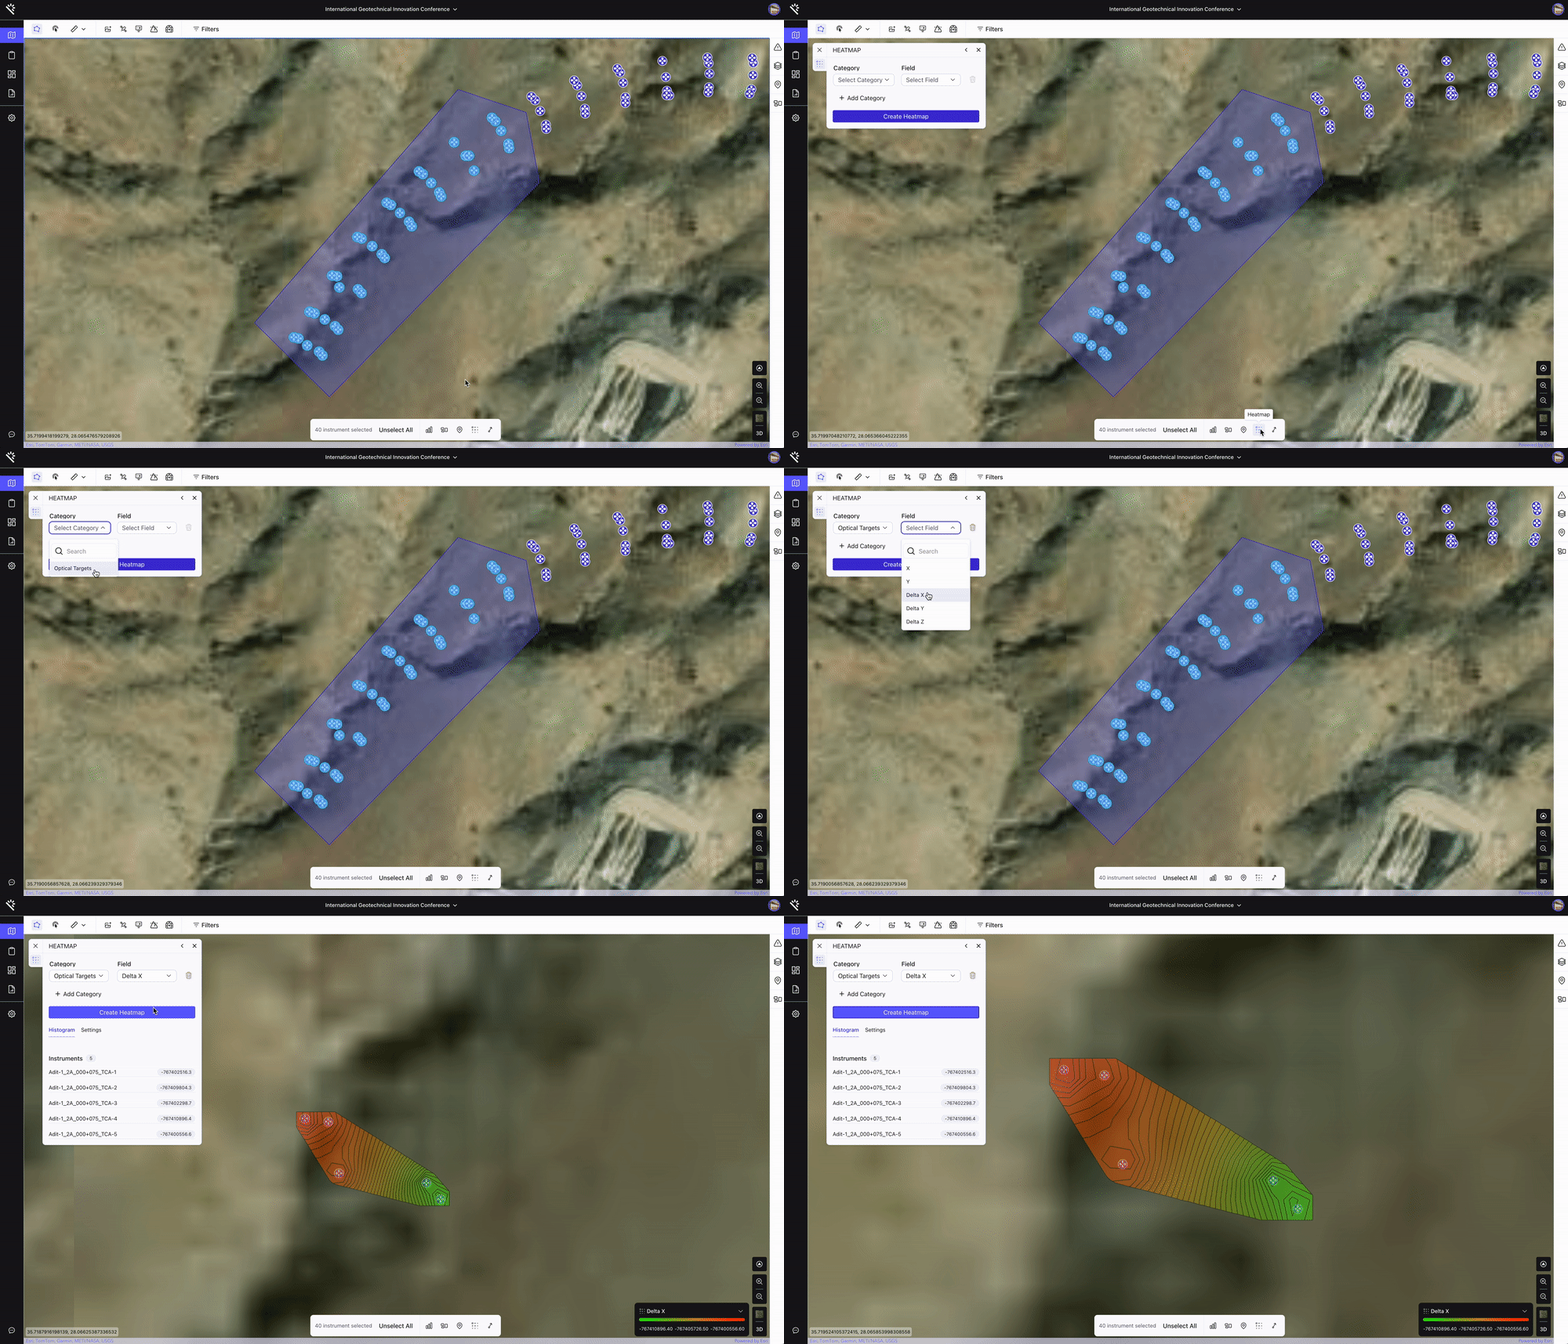
1. After finalizing your area, use the bottom toolbar and locate Heatmap tool.
2. Click on the **Heatmap icon**
3. A panel on map shows up. Fill the parameters according the categories and fields you want to analyze and hit on Create heatmap.
4. The heatmap is created around the instruments selected within the boundary.
---
### **Heatmap settings**
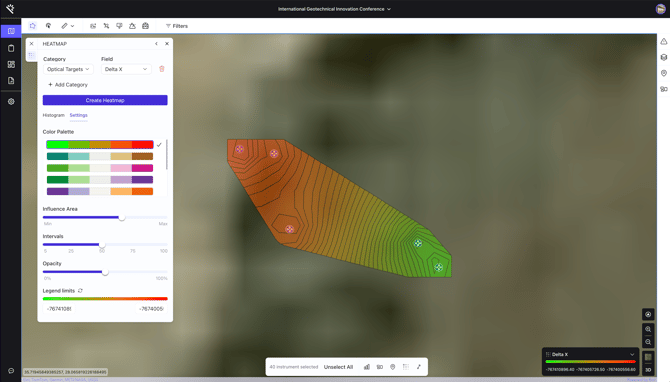
After creating a heatmap, you can adjust its settings for better visualization and analysis. The settings panel includes:
1. **Color Palette**
1. Customize the color gradient used in your heatmap.
2. Select from predefined palettes to highlight data variations effectively.
2. **Influence Area**
1. Adjust the slider to define how far data points influence surrounding areas. Use this setting to control the smoothness of transitions between colors.
3. **Intervals**
1. Modify intervals to determine how granular or broad data groupings appear in your heatmap. A higher number of intervals provides finer detail.
4. **Opacity**
1. Control the transparency of your heatmap overlay.
5. **Legend Limits**
1. 1. Set minimum and maximum values for your heatmap legend.
2. This helps focus on specific data ranges by excluding outliers or irrelevant values.
- [Getting started](https://help.proqio.com/getting-started?hsLang=en#main-content)
- [Project details](https://help.proqio.com/getting-started?hsLang=en#project-details)
- [Teams and members](https://help.proqio.com/getting-started?hsLang=en#teams-and-members)
- [Account](https://help.proqio.com/getting-started?hsLang=en#account)
- [Configure Your Instruments](https://help.proqio.com/getting-started?hsLang=en#configure-your-instruments)
- [Notifications](https://help.proqio.com/getting-started?hsLang=en#notifications)
- [Connectivity methods](https://help.proqio.com/getting-started?hsLang=en#connectivity-methods)
- [Alerts](https://help.proqio.com/getting-started?hsLang=en#alerts)
- [Map](https://help.proqio.com/map?hsLang=en#main-content)
- [Tools](https://help.proqio.com/map?hsLang=en#tools)
- [Analysis](https://help.proqio.com/map?hsLang=en#analysis)
- [Monitoring](https://help.proqio.com/monitoring?hsLang=en#main-content)
- [Instruments](https://help.proqio.com/monitoring?hsLang=en#instruments)
- [Dashboard Creation & Configuration](https://help.proqio.com/dashboard-creation-configuration?hsLang=en)
- [Report Creation](https://help.proqio.com/report-creation?hsLang=en)
- [New Feature Releases](https://help.proqio.com/new-feature-releases?hsLang=en)
- [Project Hierarchy](https://help.proqio.com/project-hierarchy?hsLang=en)
- [Analyse and Interpret your Data](https://help.proqio.com/analyse-and-interpret-your-data?hsLang=en)
- [Learn How to Navigate Proqio](https://help.proqio.com/learn-how-to-navigate-proqio?hsLang=en)
- [Configure Your Map View](https://help.proqio.com/configure-your-map-view?hsLang=en)
- [How to Add a Real Time Picture on Map](https://help.proqio.com/how-to-add-a-real-time-picture-on-map?hsLang=en)
- [Managing Your Data](https://help.proqio.com/managing-your-data?hsLang=en)
- [Uploading Records Manually](https://help.proqio.com/uploading-records-manually?hsLang=en#main-content)
- [Steps for uploading instrument data records manually](https://help.proqio.com/uploading-records-manually?hsLang=en#steps-for-uploading-instrument-data-records-manually)
- [ADA](https://help.proqio.com/ada?hsLang=en)
- [Digital Twin](https://help.proqio.com/digital-twin?hsLang=en)
- [Lines and Textures](https://help.proqio.com/lines-and-textures?hsLang=en)
[](http://www.proqio.com?hsLang=en)
Copyright © 2026, Proqio