---
title: Instrument states
description: "Understanding the nuanced difference between \"Active\" and \"Data Reception\" statuses is crucial for effective monitoring. They are complementary but distinct mechanisms that provide comprehensive insight into your instrument's operational status."
---
[Skip to content](https://help.proqio.com/instrument-states#main-content)
[](https://help.proqio.com/?hsLang=en)
Open main navigation
Close main navigation
How can we help you?
- There are no suggestions because the search field is empty.
1. [Knowledge base](https://help.proqio.com/?hsLang=en)
2. [Monitoring](https://help.proqio.com/monitoring?hsLang=en)
3. [Instruments](https://help.proqio.com/monitoring?hsLang=en#instruments)
# Instrument states
## In Proqio's monitoring system, two seemingly similar statuses often cause confusion: the "Active" property of an instrument and its "Data Reception" status. While they might appear related, they serve distinctly different purposes in the monitoring ecosystem.
---
### The difference between "Active" and "Data Reception"
#### **1. Active status: System Processing Preference**
**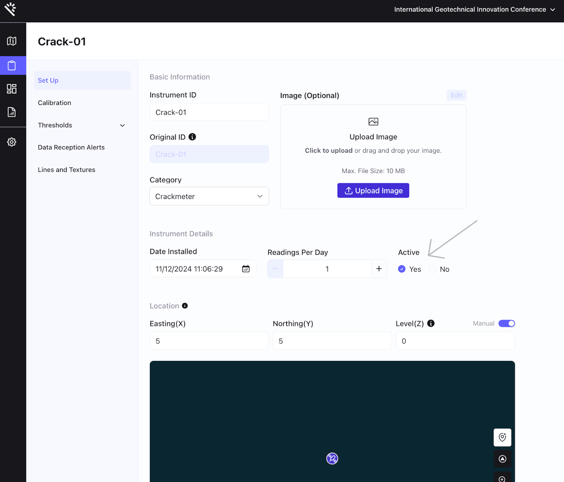**
**What "Active" Really Means:**
- A toggle that determines whether the system should process readings from an instrument
- Completely controlled by user configuration
- Independent of actual data reception
- Used to include or exclude an instrument from active monitoring
**When to Use Active Status:**
- Temporarily pause data collection for a specific instrument
- Maintain instrument configuration while stopping data processing
- Prepare for maintenance or calibration periods
**Example Scenario:** If a vibration sensor is undergoing maintenance, you can set it to "Inactive" to prevent its readings from being processed, without removing its configuration from the system.
---
#### **2\. Data Reception status: Alert Configuration**
**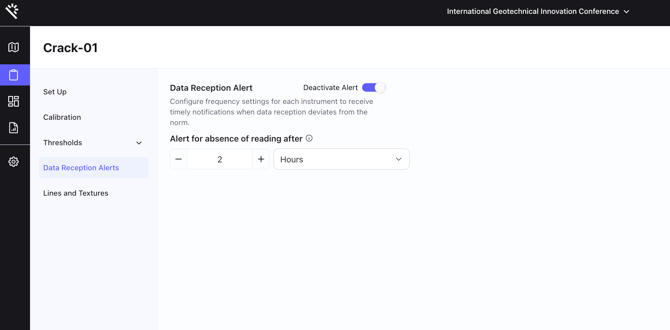**
**What Data Reception Status Represents:**
- Indicates the configuration of data reception alerts
- Green status means an alert is configured for the sensor
- Does NOT directly indicate whether data is currently being received
- Relates to the alert mechanism, not the actual data flow
**Key Characteristics:**
- Configured separately from the instrument's active/inactive state
- Provides a mechanism to monitor data reception health
- Helps identify potential communication or transmission issues
---
### Data Reception alert mechanism
**How Data Reception Alerts Work:**
1. Timing is based on actual reception time
- Calculated from when data reaches the system (FTP)
- NOT based on the timestamp within the data itself
2. Recomputing data resets the alert
- If data is recomputed, it counts as "new" data
- Alert status is reset upon recomputation
**Practical Example:** Imagine a temperature sensor:
- Data timestamp: March 1st
- Actual reception time: March 25th
- Data Reception Alert starts counting from March 25th
- If the data is recomputed on March 26th, the alert timer resets
---
### Putting it all together: A comprehensive view
**Scenario Walkthrough:**
1. Instrument is set to "Active"
2. Data Reception Alert is configured (green status)
3. Data arrives at the system
4. System processes the data
5. Alert mechanism monitors time since last reception
**Important Distinctions:**
- An "Active" instrument can have no data
- A "Green" Data Reception status doesn't guarantee current data flow
- Recomputation can artificially "refresh" the data reception timer
#### **Best Practices**
1. **Regularly Review Instrument Statuses**
- Check both Active and Data Reception settings
- Understand the difference to prevent monitoring gaps
2. **Configure Alerts Thoughtfully**
- Set realistic thresholds for data reception
- Consider instrument-specific characteristics
3. **Investigate Anomalies**
- If an active instrument shows no recent data, investigate why
- Check both system configurations and physical instrument status
#### **Troubleshooting Tips**
- **Instrument Not Showing Data?**
- Verify Active status
- Check Data Reception Alert configuration
- Inspect physical connections and instrument health
- **Unexpected Alert Resets?**
- Look for recent data recomputations
- Review user actions or automated system processes
**Conclusion**
Understanding the nuanced difference between "Active" and "Data Reception" statuses is crucial for effective monitoring. They are complementary but distinct mechanisms that provide comprehensive insight into your instrument's operational status. By mastering these concepts, you'll ensure more accurate, reliable, and insightful monitoring of your critical infrastructure.
- [Getting started](https://help.proqio.com/getting-started?hsLang=en#main-content)
- [Project details](https://help.proqio.com/getting-started?hsLang=en#project-details)
- [Teams and members](https://help.proqio.com/getting-started?hsLang=en#teams-and-members)
- [Account](https://help.proqio.com/getting-started?hsLang=en#account)
- [Configure Your Instruments](https://help.proqio.com/getting-started?hsLang=en#configure-your-instruments)
- [Notifications](https://help.proqio.com/getting-started?hsLang=en#notifications)
- [Connectivity methods](https://help.proqio.com/getting-started?hsLang=en#connectivity-methods)
- [Alerts](https://help.proqio.com/getting-started?hsLang=en#alerts)
- [Map](https://help.proqio.com/map?hsLang=en#main-content)
- [Tools](https://help.proqio.com/map?hsLang=en#tools)
- [Analysis](https://help.proqio.com/map?hsLang=en#analysis)
- [Monitoring](https://help.proqio.com/monitoring?hsLang=en#main-content)
- [Instruments](https://help.proqio.com/monitoring?hsLang=en#instruments)
- [Dashboard Creation & Configuration](https://help.proqio.com/dashboard-creation-configuration?hsLang=en)
- [Report Creation](https://help.proqio.com/report-creation?hsLang=en)
- [New Feature Releases](https://help.proqio.com/new-feature-releases?hsLang=en)
- [Project Hierarchy](https://help.proqio.com/project-hierarchy?hsLang=en)
- [Analyse and Interpret your Data](https://help.proqio.com/analyse-and-interpret-your-data?hsLang=en)
- [Learn How to Navigate Proqio](https://help.proqio.com/learn-how-to-navigate-proqio?hsLang=en)
- [Configure Your Map View](https://help.proqio.com/configure-your-map-view?hsLang=en)
- [How to Add a Real Time Picture on Map](https://help.proqio.com/how-to-add-a-real-time-picture-on-map?hsLang=en)
- [Managing Your Data](https://help.proqio.com/managing-your-data?hsLang=en)
- [Uploading Records Manually](https://help.proqio.com/uploading-records-manually?hsLang=en#main-content)
- [Steps for uploading instrument data records manually](https://help.proqio.com/uploading-records-manually?hsLang=en#steps-for-uploading-instrument-data-records-manually)
- [ADA](https://help.proqio.com/ada?hsLang=en)
- [Digital Twin](https://help.proqio.com/digital-twin?hsLang=en)
- [Lines and Textures](https://help.proqio.com/lines-and-textures?hsLang=en)
[](http://www.proqio.com?hsLang=en)
Copyright © 2026, Proqio