---
title: Navigating Instruments on the Map
description: Learn how to navigate instruments on Proqio
---
[Skip to content](https://help.proqio.com/navigating-instruments-on-the-map#main-content)
[](https://help.proqio.com/?hsLang=en)
Open main navigation
Close main navigation
How can we help you?
- There are no suggestions because the search field is empty.
1. [Knowledge base](https://help.proqio.com/?hsLang=en)
2. [Learn How to Navigate Proqio](https://help.proqio.com/learn-how-to-navigate-proqio?hsLang=en)
# Navigating Instruments on the Map
## Proqio’s interactive dashboards deliver instant, intuitive insights through powerful hover and click features making sensor data easy to access, analyze, and act on. With smart color-coded alerts, you can instantly ascertain sensor status and respond to changing conditions with confidence and speed.
#### **Understanding Hover and Click Functionalities in Sensor Dashboards**
Proqio sensor dashboards are designed to provide intuitive, real-time insights through interactive elements. Two of the most powerful features that enhance user experience are **hover** and **click** functionalities. These allow us to quickly access sensor data, visualize trends, and take action - all with minimal effort.
#### **Hover Functionality**
Hover is triggered when the mouse pointer moves over a sensor icon or element without clicking
**What You See When Hovering**:
- **Labels**: Sensor name or ID for quick identification.
- **Parameter Values**: Real-time readings such as temperature, X, Y, etc.
- **Alert Status**: Visual cues indicating whether the sensor is in a normal, warning, or critical state.
Hovering gives us a **quick overview** of the sensor’s condition, helping us grasp the situation at a glance without navigating away from the main dashboard.
#### **Click Functionality**
Click function is activated when you press and releases the mouse button on a sensor or interface element.
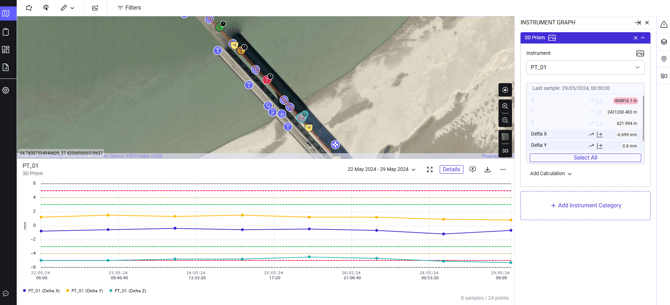
**What happens when you click on an instrument/sensor:**
When you click on an instrument or sensor, a detailed data panel opens up, offering multiple ways to interact with and analyze the sensor's readings. For example, you can select a date range to view the data on graph in a specific time frame or maximize the graph to enlarge the view. You will find multiple options on the panel as mentioned below.
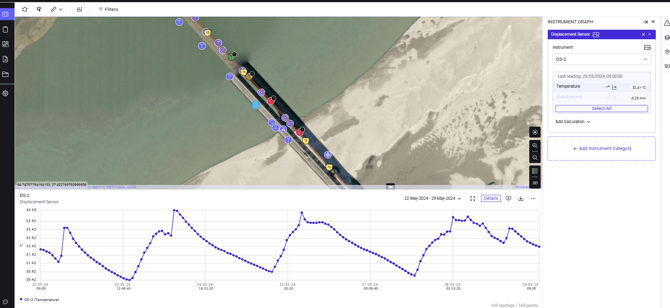
- **Date Range Selection**: It enables choosing specific time periods in order to analyze trends and viewing historical data in graph form.
- **Maximize Graph **: Enlarge the graph for better readability and analysis.
- **Details Button **: Access a new section with comprehensive sensor data. Sensor-specific information includes: Graphs, data history, documents, annotations.
- **Add Annotation **: Click on the graph to place a note. Write your annotation and save it, it will appear directly on the graph.
- **Download CSV **: Export sensor data for the selected time period in CSV format.
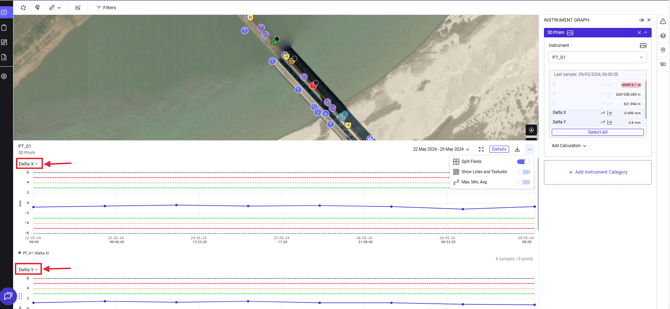
- **Three Dots Menu **: it gives you below options
- - Split fields help you to view each parameter in separate graphs.
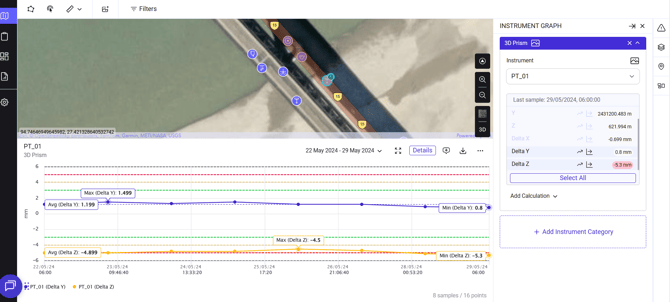
- - - You can view Minimum, Maximum and Average points on the graph.
- Shows line and textures on graph.

- **Instrument Graph Window**:
- It allows users to add multiple instruments on the same graph to view all the data together.
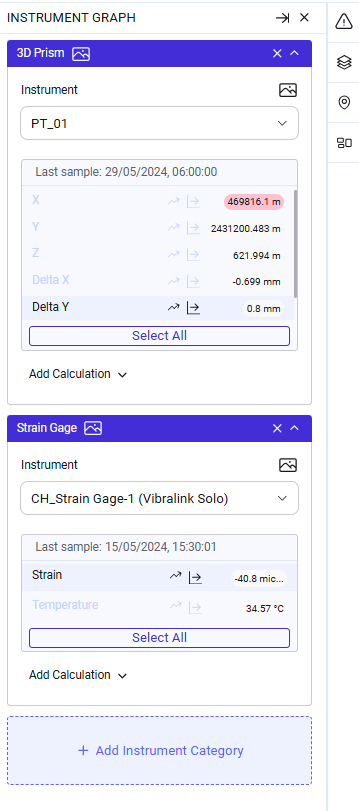
- Users can toggle parameters for tailored views, which means you can also select or deselect parameters of the same sensor to customize the graph view.
---
#### **Understanding Instrument Icon Colors for Sensor Alerts**
Instrument icon colors provide a quick visual cue to help identify the **status of a sensor**. These colors are linked to thresholds you've configured and allow you to respond more effectively to changing conditions.
To learn how to set up thresholds and customize alerts, refer to the article: [**Setting up Alerts**](https://help.proqio.com/setting-up-alerts?hsLang=en).
**What Each Color Represents**
Each icon color corresponds to a specific alert level:
- Here's an **example** of how each color can represent a different alert level.
| **Icon Color** | **Alert Level** | **Description** |
| --- | --- | --- |
|  Green | Attention Required | Sensor is active and may need observation, but no immediate action needed. |
|  Amber | Warning/Action | Sensor is nearing threshold; monitor closely. |
|  Red | Critical | Sensor has exceeded threshold; immediate action required. |
| **** Default instrument icon color | Normal | Sensor is operating within expected parameters; no alerts triggered. |
|  Black icon on sensor | No data Received  | A small black circle with an exclamation mark appears on the icon after a set time period, indicating a potential issue with data transmission. |
**Note: Customizing instrument icon colors**
You can **set or change** the instrument icon colors from the **configuration tab** under **project settings**. This allows you to tailor the alert visuals to your preferences or operational standards.
- [Getting started](https://help.proqio.com/getting-started?hsLang=en#main-content)
- [Project details](https://help.proqio.com/getting-started?hsLang=en#project-details)
- [Teams and members](https://help.proqio.com/getting-started?hsLang=en#teams-and-members)
- [Account](https://help.proqio.com/getting-started?hsLang=en#account)
- [Configure Your Instruments](https://help.proqio.com/getting-started?hsLang=en#configure-your-instruments)
- [Notifications](https://help.proqio.com/getting-started?hsLang=en#notifications)
- [Connectivity methods](https://help.proqio.com/getting-started?hsLang=en#connectivity-methods)
- [Alerts](https://help.proqio.com/getting-started?hsLang=en#alerts)
- [Map](https://help.proqio.com/map?hsLang=en#main-content)
- [Tools](https://help.proqio.com/map?hsLang=en#tools)
- [Analysis](https://help.proqio.com/map?hsLang=en#analysis)
- [Monitoring](https://help.proqio.com/monitoring?hsLang=en#main-content)
- [Instruments](https://help.proqio.com/monitoring?hsLang=en#instruments)
- [Dashboard Creation & Configuration](https://help.proqio.com/dashboard-creation-configuration?hsLang=en)
- [Report Creation](https://help.proqio.com/report-creation?hsLang=en)
- [New Feature Releases](https://help.proqio.com/new-feature-releases?hsLang=en)
- [Project Hierarchy](https://help.proqio.com/project-hierarchy?hsLang=en)
- [Analyse and Interpret your Data](https://help.proqio.com/analyse-and-interpret-your-data?hsLang=en)
- [Learn How to Navigate Proqio](https://help.proqio.com/learn-how-to-navigate-proqio?hsLang=en)
- [Configure Your Map View](https://help.proqio.com/configure-your-map-view?hsLang=en)
- [How to Add a Real Time Picture on Map](https://help.proqio.com/how-to-add-a-real-time-picture-on-map?hsLang=en)
- [Managing Your Data](https://help.proqio.com/managing-your-data?hsLang=en)
- [Uploading Records Manually](https://help.proqio.com/uploading-records-manually?hsLang=en#main-content)
- [Steps for uploading instrument data records manually](https://help.proqio.com/uploading-records-manually?hsLang=en#steps-for-uploading-instrument-data-records-manually)
- [ADA](https://help.proqio.com/ada?hsLang=en)
- [Digital Twin](https://help.proqio.com/digital-twin?hsLang=en)
- [Lines and Textures](https://help.proqio.com/lines-and-textures?hsLang=en)
[](http://www.proqio.com?hsLang=en)
Copyright © 2026, Proqio
```json
{
"@context" : "https://schema.org",
"@type" : "VideoObject",
"contentUrl" : "https://stream.mux.com/Xe1SE02oPaWeyJTLwpc6b4vpZUYTMPy5IxPNKjsjwwPc/capped-1080p.mp4",
"dateModified" : "2025-09-11T04:24:25.921Z",
"duration" : "PT17S",
"height" : 886,
"name" : "Screen Recording 2025-09-11 095317",
"thumbnailUrl" : "https://145149017.fs1.hubspotusercontent-eu1.net/hubfs/145149017/Screen%20Recording%202025-09-11%20095317.mp4/medium.jpg",
"uploadDate" : "2025-09-11T04:24:22.574Z",
"width" : 1902
}
```
```json
{
"@context" : "https://schema.org",
"@type" : "VideoObject",
"contentUrl" : "https://stream.mux.com/1XczhKcAKBeJvvCWernjUqLXE3GLWMazHwfo5SvYFi4/capped-1080p.mp4",
"dateModified" : "2025-09-11T04:14:22.529Z",
"duration" : "PT13S",
"height" : 882,
"name" : "Screen Recording 2025-09-11 094319",
"thumbnailUrl" : "https://145149017.fs1.hubspotusercontent-eu1.net/hubfs/145149017/Screen%20Recording%202025-09-11%20094319.mp4/medium.jpg",
"uploadDate" : "2025-09-11T04:14:16.185Z",
"width" : 1894
}
```