---
title: Unified Instrument Details and Setup Section
description: Experience a streamlined interface in Proqio’s redesigned instrument management — unifying setup and details into one cohesive view for faster, easier navigation without switching screens.
---
[Skip to content](https://help.proqio.com/unified-instrument-details-and-setup-section-0#main-content)
[](https://help.proqio.com/?hsLang=en)
Open main navigation
Close main navigation
How can we help you?
- There are no suggestions because the search field is empty.
1. [Knowledge base](https://help.proqio.com/?hsLang=en)
2. [Monitoring](https://help.proqio.com/monitoring?hsLang=en)
3. [Instruments](https://help.proqio.com/monitoring?hsLang=en#instruments)
# Unified Instrument Details and Setup Section
## This functionality introduces a major redesign that combines all instrument-related information and configuration options into a single, structured interface. This update merges the previous Instrument Setup and Instrument Details areas into one cohesive space — making it easier to operate on Proqio without switching between screens.
### **Why is this functionality useful?**
This unification streamlines your workflow and significantly improves navigation efficiency. By consolidating all relevant instrument data and configuration actions, users can:
- Access essential information at a glance.
- Switch seamlessly between viewing, editing, and monitoring instrument details.
- Reduce the time spent navigating multiple sections.
---
### **Feature Highlights**
- **Persistent Header:** The most important instrument details remain visible across all tabs.
- Instrument Name
- Category & Type
- Original Instrument ID
- State (Active / Inactive)
- Alert Status (based on the project alert configuration)
- Data Reception Status (Receiving / Not receiving / Not configured)
- Associated Sites and Groups
- **Tabbed Interface:** All functionality is now organized into a clear, logical set of tabs:
1. **Overview (Instrument Dashboard)** – View a high-level summary of the instrument’s status and recent activity.
2. **History** – Displays the complete history list, identical to the previous instrument details section.
3. **Documents** – Access the full list of associated documents.
4. **Annotations** – Review and manage all annotations linked to the instrument.
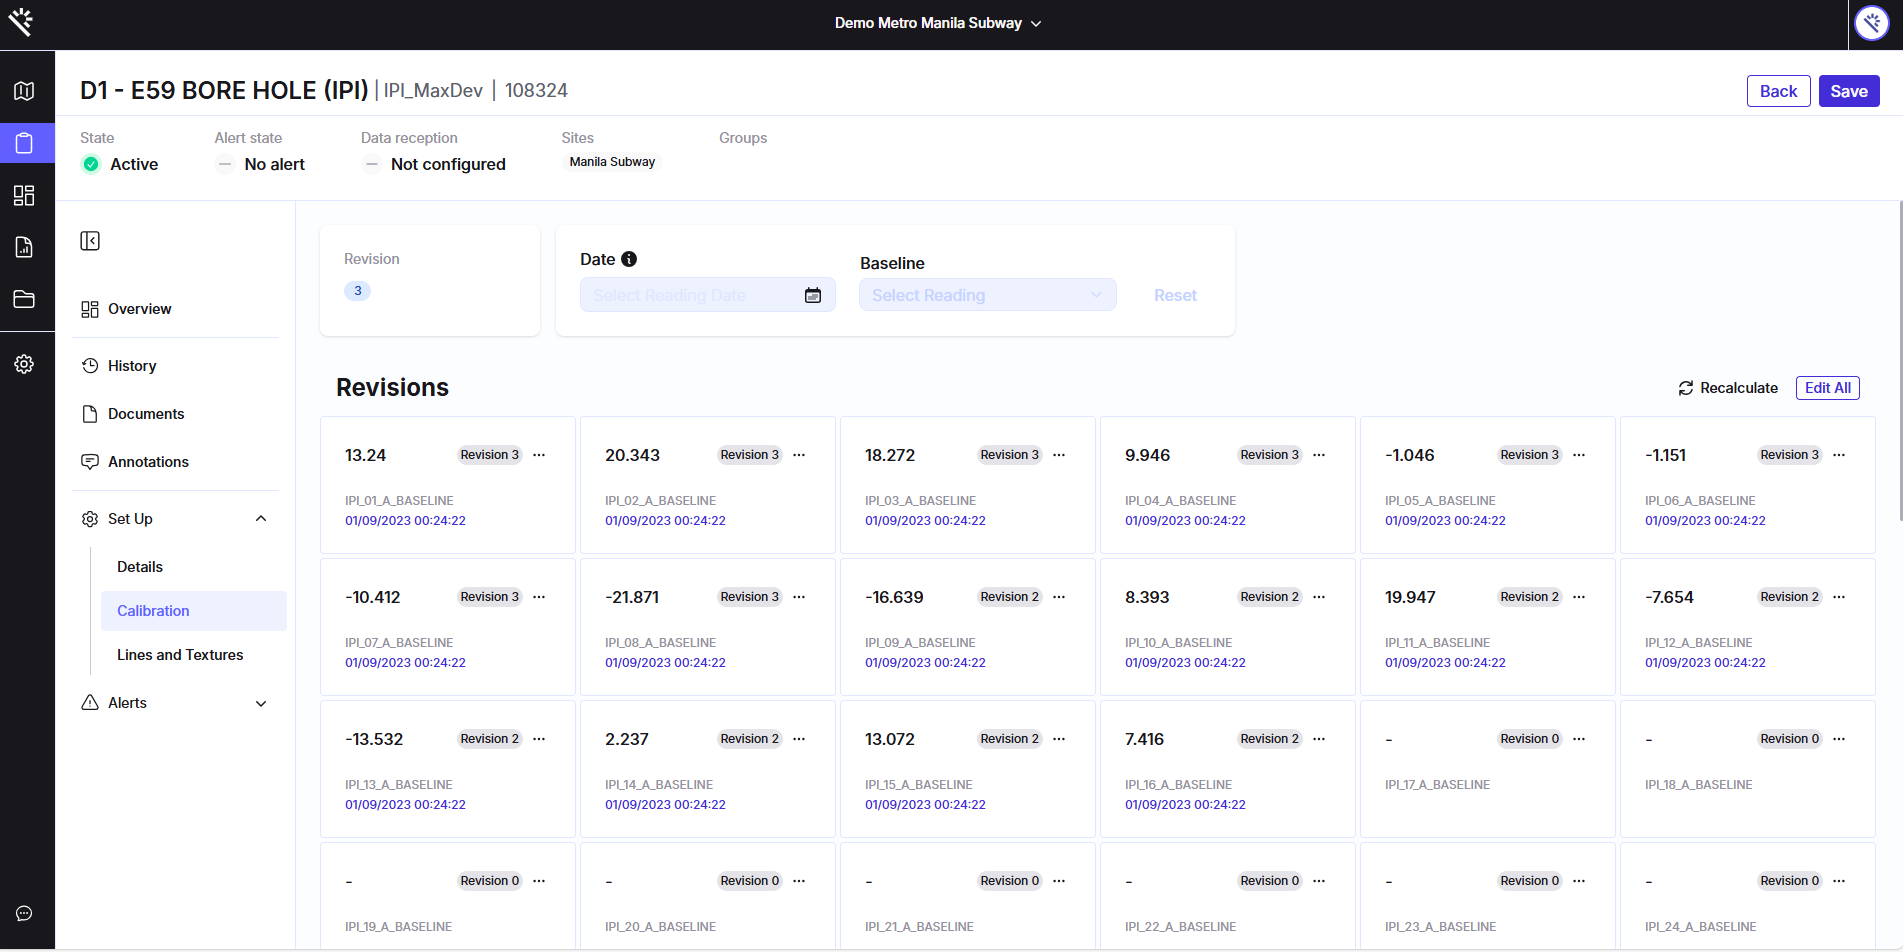
5. **Setup (Configuration Hub)** – The central area for setup and calibration:
- **Configuration:** Main setup view for instrument parameters.
- **Calibrations:** Now presented in a streamlined table view instead of the previous box layout.
- **Lines & Textures:** Retains the familiar configuration options from the previous setup.
6. **Alerts:** Organized into two parts for better clarity:
- **Alert History:** Table view of past alerts, scoped to the current instrument.
- **Alert Setup (Thresholds):** Manage thresholds using intuitive field-switching controls and dropdown menus.
- **Outliers:** Define limits to automatically remove erroneous readings.
7. **Data Reception:** Also presented in two segments:
- **Setup:** Configure data reception settings (same as before).
- **History of Data Reception Alerts:** Simple table showing alert-triggered dates for reception issues.
---
### **How does it work?**
1. **Access the Unified View:** Open any instrument, and you’ll now see all information consolidated under one unified interface.
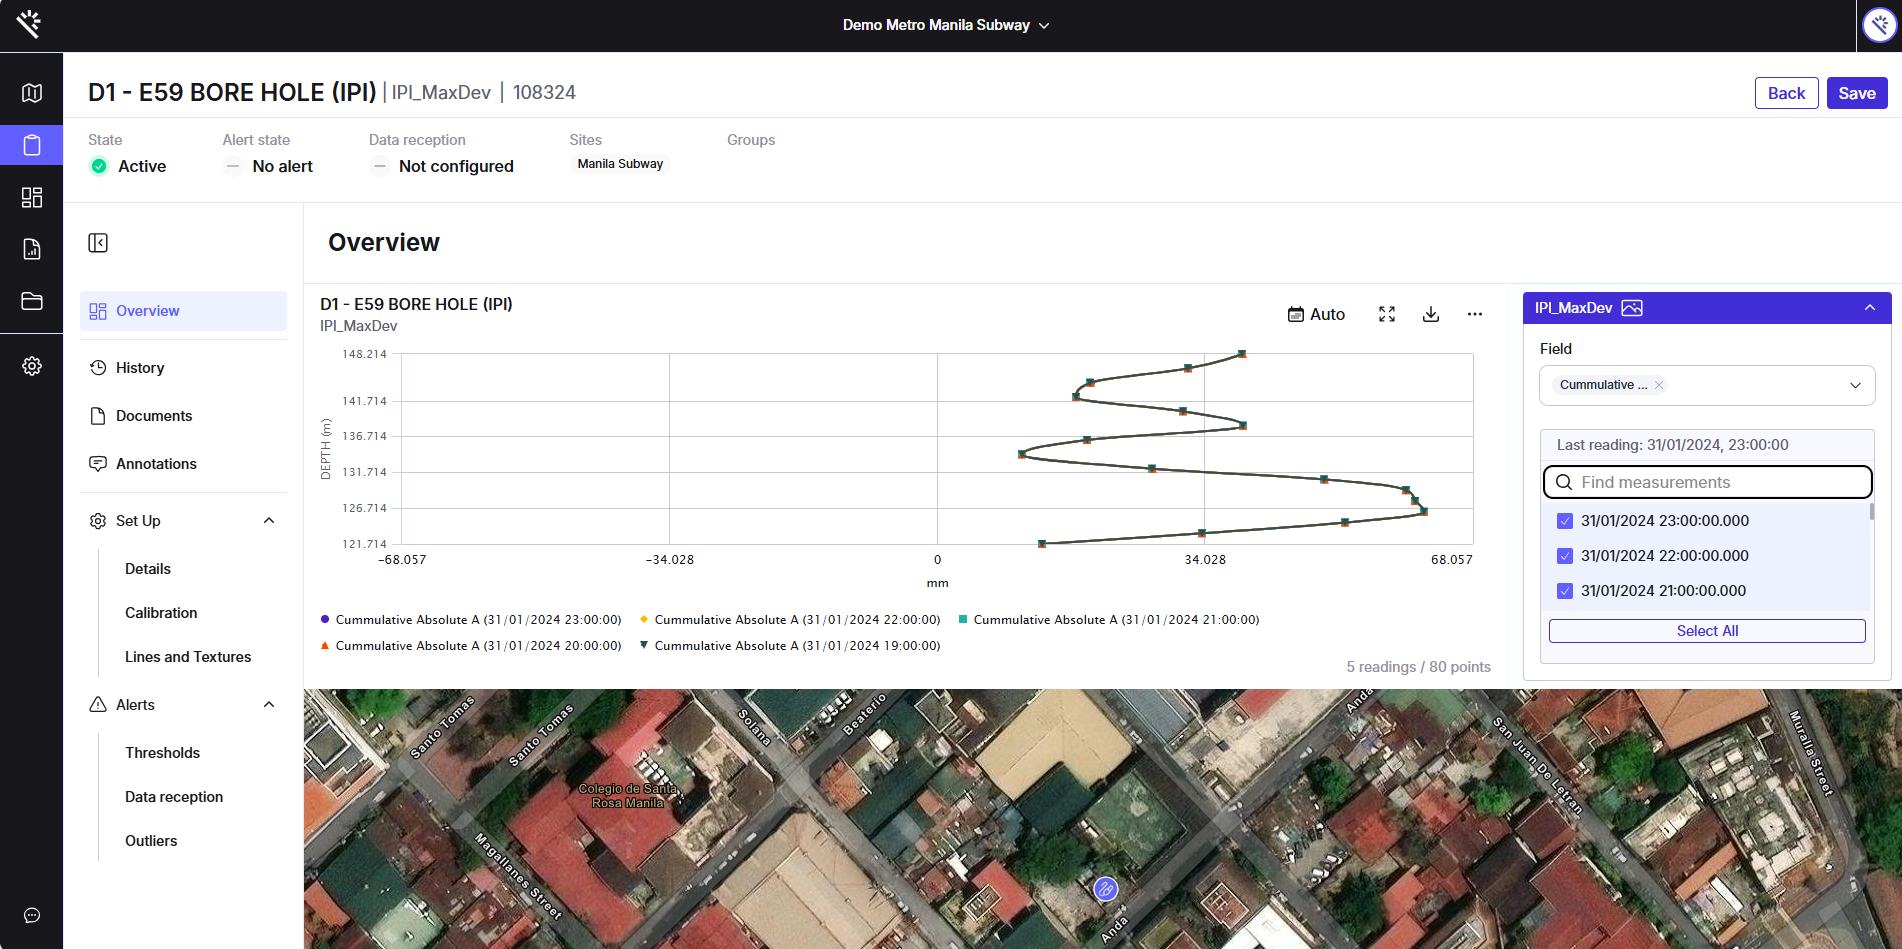
2. **Review Key Details:** The persistent header at the top ensures that identification and status details are always visible. This allows users to quickly assess alert status, data reception issues, and instrument active status.

3. **Navigate Through Tabs:** Use the new tab bar to switch between Overview, Setup, Alerts, and other sections. Each tab focuses on a specific type of data or configuration, reducing clutter and improving usability.
4. **Update and Manage Configurations:** All setup and calibration actions are centralized under the *Setup* tab, with simplified table layouts for faster updates.

- [Getting started](https://help.proqio.com/getting-started?hsLang=en#main-content)
- [Project details](https://help.proqio.com/getting-started?hsLang=en#project-details)
- [Teams and members](https://help.proqio.com/getting-started?hsLang=en#teams-and-members)
- [Account](https://help.proqio.com/getting-started?hsLang=en#account)
- [Configure Your Instruments](https://help.proqio.com/getting-started?hsLang=en#configure-your-instruments)
- [Notifications](https://help.proqio.com/getting-started?hsLang=en#notifications)
- [Connectivity methods](https://help.proqio.com/getting-started?hsLang=en#connectivity-methods)
- [Alerts](https://help.proqio.com/getting-started?hsLang=en#alerts)
- [Map](https://help.proqio.com/map?hsLang=en#main-content)
- [Tools](https://help.proqio.com/map?hsLang=en#tools)
- [Analysis](https://help.proqio.com/map?hsLang=en#analysis)
- [Monitoring](https://help.proqio.com/monitoring?hsLang=en#main-content)
- [Instruments](https://help.proqio.com/monitoring?hsLang=en#instruments)
- [Dashboard Creation & Configuration](https://help.proqio.com/dashboard-creation-configuration?hsLang=en#main-content)
- [Dashboards](https://help.proqio.com/dashboard-creation-configuration?hsLang=en#dashboards)
- [Report Creation](https://help.proqio.com/report-creation?hsLang=en)
- [New Feature Releases](https://help.proqio.com/new-feature-releases?hsLang=en)
- [Project Hierarchy](https://help.proqio.com/project-hierarchy?hsLang=en)
- [Analyse and Interpret your Data](https://help.proqio.com/analyse-and-interpret-your-data?hsLang=en)
- [Learn How to Navigate Proqio](https://help.proqio.com/learn-how-to-navigate-proqio?hsLang=en)
- [Configure Your Map View](https://help.proqio.com/configure-your-map-view?hsLang=en)
- [How to Add a Real Time Picture on Map](https://help.proqio.com/how-to-add-a-real-time-picture-on-map?hsLang=en)
- [Managing Your Data](https://help.proqio.com/managing-your-data?hsLang=en)
- [Uploading Records Manually](https://help.proqio.com/uploading-records-manually?hsLang=en#main-content)
- [Steps for uploading instrument data records manually](https://help.proqio.com/uploading-records-manually?hsLang=en#steps-for-uploading-instrument-data-records-manually)
- [ADA](https://help.proqio.com/ada?hsLang=en)
- [Digital Twin](https://help.proqio.com/digital-twin?hsLang=en)
- [Lines and Textures](https://help.proqio.com/lines-and-textures?hsLang=en)
[](http://www.proqio.com?hsLang=en)
Copyright © 2026, Proqio